Wednesday, 27 July 2016
Wednesday, 13 July 2016
concepts of revenue
meaning of revenue or sale proceed
by selling the commodity what ever money is received by the firm is called revenue.
suppose you are running a factory producing chocolates. you produce 1000 chocolates daily. by selling these chocolates you get RS 2,000. in economics , this amount of rs 2,000 is called revenue. thus, by selling a commodity whatever money a firm receives is called revenue.
or
revenue is the money received from sale of commodity.
difference between revenue and profits?
revenue and profits are different concepts
the concept of revenue is different from the concept of profit .
the following equations shows the difference:-
profit = revenue - cost
revenue = costs + profit
concepts of revenue
i) TR ( total revenue)
ii)AR (average revenue)
iii)MR (marginal revenue)
i) total revenue (TR) :-
a revenue that a firms get by selling a given amount of output that is called total revenue.
TR = P*Q
TR = TOTAL REVENUE
P = PRICE PER UNIT
Q = QUANTITY SOLD
or
TR =SUMMATION OF MR
TR = TOTAL REVENUE
MR = MARGINAL REVENUE
marginal revenue ( MR)
it is change in total revenue as a result of selling an additional unit of output is known as marginal revenue. however it can be positive, zero nd negative.
MRn =TRn - TRn-1
MRn = marginal revenue of n units
TRn = total revenue of n units
TRn-1 = total revenue of n-1 units
or
example
P Q TR = P*Q MR
5 1 5 5
4 2 8 3
3 3 9 1
2 4 8 -1
1 5 5 -3
MR2 =TR2 - TR1
= 8 - 5
= 3
average rvenue
it is the revenue per unit of output. it is obtained by dividing T. R with the quantity sold . AR is equal to price.
AR = Average revenue
TR = Quantity sold
Q TR AR = TR/Q
1 10 10
2 20 10
3 30 10
4 40 10
Q4 show that AR = price ?
Ans. we know that
AR = TR/Q
we also known that TR = P ( where P = quantity or output sold)
relating the two equations we write that;
AR = P*Q/Q = P
thus it is proved that AR = price
Q5 Firm's demand curve or price line is the same as AR curve ?
ans. firm's demand curve or price line is the same as firm's AR curve, because AR means price\, and demand curve ( or Ar curve ) shows the relationship between price and quantity demanded of firm's output.
Q^ what is relationship between TR, AR and MR under perfect competition ?
Ans. perfect competition is a market in which there are large number of buyers and sellers where as in this market product produce is homogonous and there is free entry and exit of firms .
in such a market price of commodity is determined by industry and firm followed that price A firm can sell any amount of commodity at this price.
price Q TR = P*Q MR AR = TR/Q
10 1 10 10 10
10 2 20 10 10
10 3 30 10 10
10 4 40 10 10
10 5 50 10 10
!. it is clear from diagram MR is constant so TR is increasing at constant rate therefore TR is in a straight line moving upward.
2. AR and MR are equal to each other and it is shown by horizontal straight line where as AR = MR because industry is a pric maker and firm is price taker.
Q7 prove that area under AR & MR curve is equal to Tr in case of perfect competition ?
Ans. in case of perfect competition AR is constant therefore AR = MR. AR curve is horizontal line which represents the value of different level of output at uniform prove.
in the diagram, price ( equal to OP) is constant and output is equal to OQ.
TR = P*Q
= OP*OQ
Area = OPRQ
Q8. what is relationship between TR,AR and MR?
Ans. the relationship between TR,AR and MR can be explained with the help of diagram.
p Q TR MR AR
10 1 10 10 10
9 2 18 8 9
8 3 24 6 8
7 4 28 4 7
6 5 30 2 6
5 6 30 0 5
4 7 28 -2 4
3 8 24 -4 3
2 9 18 -6 2
1 10 10 -8 1
1. when MR is positive then TR is increasing as in the diagram upto point K, MR is positive. so, TR is increasing upto point E1.
2. when MR is zero then TR is maximum as in the diagram at point K, MR is 0 and TR is maximum at point K'
3. when MR is negative then, TR is falling as after point k, MR is negative and TR is falling. after point K'.
4. both AR and MR are decreasing but MR is falling at faster rate. so, MR is below than the AR.
5. MR can be negative but TR and MR cannot be.
6. both TR ad MR can be calculated from TR.
(a) MR = TRn - TRn-1
(b)AR = TR/Q
Q9 can MR be zero or negative ?
Ans. Yes, MR can be zero or negative. it is clear from the following illustrations;
Average revenue output (units) total revenue marginal
price (Rs.) (Rs.) revenue (Rs.)
100 1 100 100
80 2 160 60
40 3 160 0
30 4 150 -10
1. MR can be zero or even negative, but only when price is declining as under monopoly or monopolistic competition.
2. TR stops increasing when MR = 0 so that TR is maximum when MR = 0.
3. TR starts declining, less and less added to TR is every additional unit is sold. accordingly, TR increases only at the diminishing rate.
Q10 what is firm's price line/ what is its shape?
Ans. firm's price line is the same as firm's AR curve. under perfect competition, firm's price line is a horizontal straight line. both AR and MR tend to coincide (AR=MR). under monopoly or monopolistic competition, firm's price line slopes downward. when AR sloped downward, MR also slopes downward, MR<AR.
Tuesday, 12 July 2016
price elasticity of demand
introduction of elasticity of demand
law of demand tells us that with the increase in price demand falls and with the fall in price demand increases. it does not tell about how much is the change in the demand due to change in price. elasticity of demand tells us about how much is the change in demand due to change in price, income and price of related goods.
meaning of elasticity
it means responsiveness of a dependent variable to change in independent variable.
or
it refers to the % change in qty. demanded and % change in own price of the commodity.
meaning of elasticity of demand
it is the demand which is affected by 3 factors.
i) price :- when demand changes due to change in the price of the commodity is called price elasticity of demand.
ii) income :- when demand changes due to change in income of the consumer i.e. called income elasticity of demand.
iii) related goods :- when there is change in demand due to change in price of related goods that is called cross elasticity of demand.
price elasticity of demand :-
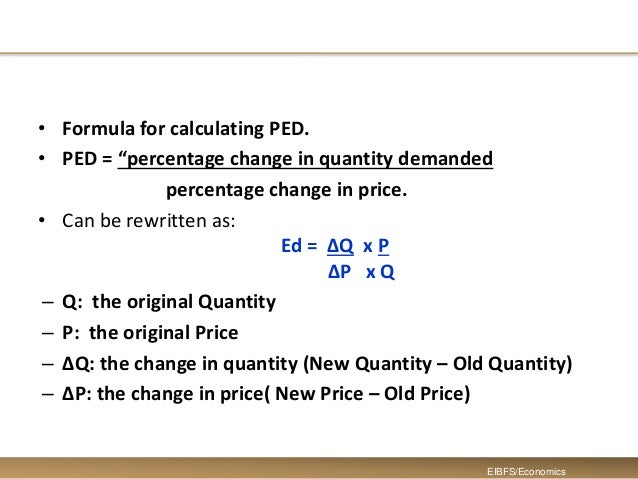
the ratio of % change in demand due to % change in price i.e. called price elasticity of demand
degrees/types/kinds/ of price elasticity of demand
there as 5 degrees of price elasticity of demand.
i) perfectly inelastic demand or zero elasticity of demand :-
when there is no change in demand due to change in price of commodity i.e. called perfectly, inelastic demand for e.g. salt, life, saving, drugs.
price demand
10 10
11 10
12 10
13 10
14 10
15 10
it is clear from the diagram that demand curve is parallel to or vertical line to 'y' axis i.e. there is no change in demand due to change in price. so here ed is equal to zero. it is known as completely or totally inelastic demand.
ii) less elastic demand or inelastic demand or less than unitary elastic demand :-
when % change in price is greater than % change in demand than elasticity of demand is less than unitary elastic demand ex. food, fuel etc.
price demand
10 10
5 11
it is clear from the table that price falls by 5 Rs demand increases by 1 unit. this ed is said to be less than one.
it is clear from the diagram % change in price PP1 is > than % change in demand QQ1 i.e. why elasticity of demand is less than unitary elastic demand. the shape of demand curve is steeper.
iii) unitary elastic demand
when % change in price is equal to % change in demand than elasticity of demand is unitary elastic demand for e.g. clothes, normal goods.
price demand
10 10
9 11
it is clear from the table that price falls by 1 Rs and demand increases by 1 unit. the ed is said to be unitary elastic.
it is clear from the diagram that % change in price PP1 is equal to % change in demand QQ1 so elasticity f demand is unitary. in this case area covered by each rectangle is equal so it takes the shape of rectangular hyperbola.
iv) greater than unitary elastic demand or elastic demand ;-
when % change in demand is greater than % change in price than elasticity is greater than unitary elastic demand. for example luxuries ( costly cars, costly carpets).
price demand
10 10
9 15
it is clear from the table price falls by 1 Rs and demand increases by 5 units. so ed said to be more elastic.
it is clear from the diagram that % change in demand QQ1 is greater than % change in price PP1 so elasticity of demand is greater than unitary elastic demand. the shape of demand curve is flatter.
v) perfectly elastic demand or infinite elasticity of demand :-
when demand is infinite at the existing price than elasticity of demand is perfectly elastic in real world we never come across such type of elasticity of demand.
price demand
10 10
10 11
10 12
10 13
10 14
here elasticity of demand becomes infinite and demand curve is 11 to 'x' axis. this type is an imaginary elasticity of demand so it does not exits in real world.
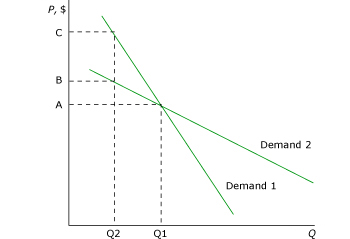
Q- when two demand curves intersect each other which is having greater elasticity of demand?
Ans - if 2 demand curves intersect each other than flatter demand curve is having greater elasticity of demand.
it is clear from the diagram that d1d1 and d2d2 are intersecting each other at point 'a' at this point price is op and qty. demanded for both the demand curve is Q2. if price falls from OB to OA the change in price is same for both the demand curves but change in Qty. demanded is different. on DD demand has increased from OQ2 to OQ1 where as for demand curve D1D1 demand has increased for OQ2 to OQ1. it is clear that % change in demand for flatter demand curve is more so elasticity of demand for flatter demand curve is more.
methods to measure PED
the following are the methods to measure price elasticity of demand
1. % method or proportionate method
2. total expenditure method or total outlay method
3. point method or graphic method
1) proportionate method or percentage method
this method was given by Dr . marshall.
according to this method elasticity of demand is the ratio of % change in demand to % change in price.
price demand
P 1 5 Q
P1 5 4 Q1
total expenditure or total outlay method
this method is given by Dr. Marshall. it works out relationship between PED and TE. this method measured PED by finding out how much and in what direction the total expenditure changed in price of the good.
according to this method total expenditure can be calculated by multiplying price per unit with qty. sold.
T.E. = P * Q
P = price per unit Q = quantity sold
according to this method there are 3 degrees of price elasticity of demand.
i) less than unitary elastic demand
ii) unitary elastic demand
iii) greater than unitary elastic demand
i) less than unitary elastic demand
when there is positive relation between price and T.E. that is with the increase in price total expenditure increase and with the decrease in price T.E. decrease.
P increases T.E increases
P decreases T.E. decreases E < 1
ii) unitary elastic demand :-
when there is no change in T.E. due to change in price is called unitary elastic demand.
price increases or decreases T.E. same E = 1
iii) greater than unitary elastic demand
when there is inverse relationship between price and T.E. that is called greater than unitary elastic demand.
price increases T.E. decreases
price decreases T.E. increases E > 1
P Q T.E. change in P PED
& TE
10 1 10
9 2 18 Price increases T.E. greater
8 3 24 increases E > 1 than one
7 4 28
6 5 30 price increases T.E. unit
5 6 30 same E = 1
4 7 28 price increases T.E. less than
3 8 24 decreases E < 1 one
note :- the relationship between P & TE based on inverse relationship between P & Q .
1. it is clear from the diagram when price falls from OP to OP1 total expenditure increases from PT to P1T1 so here elasticity of demand is greater than one.
2. when price falls from OP1 to OP2 T.E. remains the same i.e. P1T1 = P2T2 so here E = 1
3. when price falls from OP2 to OP3 T.E. falls from P2T2 to P3T3 so here elasticity of demand is E<1
point method / graphic method / geometric method
it was given by Dr. Marshall. this method is used to measure price elasticity of demand on the different points of demand curve. this method measures elasticity graphically. this method is called graphic method. According to this method following formula is used
i) elasticity of demand at the mid point of demand curve or PED = 1 :-
at the mid point of demand curve lower portion is equal to upper portion. so here elasticity of demand is unitary elastic demand.
ED at Pt A = AL
AP
AL = AP
ED = 1
ii) elasticity of demand below the mid point of demand curve PED<1 :-
in this situation lower portion is lesser than upper portion so here elasticity will be less than unitary elastic.
Ed at Pt B = BL
BP
BL<BP
ED < 1
iii) elasticity of demand above the mid point of demand curve or PED>1 :-
in this situation upper portion is less than lower portion so here elasticity of demand will be more than unitary elastic.
ED at Pt C = CL
CP
CP<CL
ED > 1
iv) elasticity of demand when demand curve touches 'x' axis or PED = 0 :-
in this situation elasticity of demand will be equal to zero.
Ed at Pt L = O
PL = 0
v) elasticity when demand curve touches Y axis or PED = infinity :-
in this situation elasticity of demand will be infinite.
Ed at Pt P = PL
O = infinity
Q- the demand curve of a commodity is a straight line sloping downward as in the diagram. write true or false against the following statements :-
i) elasticity of demand is low corresponding to lower level of price of the commodity.
ii) elasticity of demand = 0, when price = 0.
iii) elasticity of demand at point 'D' < elasticity of demand at point 'C'
Ans - the statement is true.
at a lower level of price, lower segment tends to decrease while upper segment tends to increase. implying that elasticity of demand reduces as price tends to be lower than before.
ii) the statement is true.
price = 0, at point B,
Ed at point B = O
AB = 0
Elasticity of demand = 0, when price = 0.
iii) the statement is true . because
elasticity of demand at point D is less than elasticity of demand at point c.
Q- find own price elasticity of demand when 5 percent increase in price causes 5 percent increase in expenditure on the commodity.
Ans- it is a situation of zero own price elasticity of demand. because expenditure on the commodity is increasing proportionate to increase in price, so that total purchase of the commodity remains constant. constant purchase means zero elasticity of demand.
Q- why is demand for water inelastic?
Ans- demand for water is inelastic, as water is an essential of life.
imp. factors affecting price elasticity of demand
1. nature of commodity :- by nature of commodity demand
A) necessities of life :- the goods which are necessities have inelastic demand i.e. there demand is not much affected by price. for e.g. wheat, salt, vegetables, etc.
B) luxuries :-
the goods which are luxuries such as important cars fashionable garments costly furniture, AC etc. have elastic demand because their demand is much affected by price.
C) comforts :- the goods that are comforts to the life for e.g. fans, refrigerator etc. have neither very elastic nor inelastic demand.
D) jointly demanded goods :- like bread and butter, pen and ink show a moderate elasticity of demand.
2. availability of close substitutes :-
the goods whose substitutes are available such as pepsi and coke have elastic demand where as goods whose sub are not available such as cigarettes, liquor etc. have inelastic demand.
3. different uses of commodity or diversity of uses :-
the goods which can be put to verity of uses have elastic demand for e.g. electricity, milk etc. if there price falls there demand increases much because people start using it in very less important uses. on the other hand if a commodity such as paper has only few uses, its demand is likely to be less elastic.
4. income of the consumer :-
the goods that are consumed by very high and very low income group people have inelastic demand. where as middle income group have elastic demand. for ex. demand of small cars by middle income group is elastic. where as demand of luxury cars is inelastic.
5. price level :-
if the price of a commodity is high its demand will be elastic and if price of commodity is very low then its demand is inelastic.
6. postponement of the use :-
the demand will be elastic for those commodities whose consumption can be postponed and vice - versa. such as demand of residential houses. people often defer their demand for residential houses when interest rates on loans are high.
7. habit of consumer :-
the goods to which a consumer become habitual have inelastic demand such as cigarette, liquor etc. because a person cannot live without them. on the other hand demand of cigarettes, liquor does not reduce even when these goods are heavily taxed.
importance of price elasticity of demand
I) useful to a producer :-
every producer aims at maximizing his profits by promoting his sales. to increase the sales he reduces the price of more elastic goods and charges high price for less elastic goods .
II) useful to finance minister :-
the finance minister makes the use elasticity of demand by imposing taxes in the budget he fixes more taxes on inelastic commodities and less taxes on elastic commodities.
III) importance in factor prices :-
if demand for factor price is inelastic than a factor will get high wages where as a factor will get lesser wages if demand for factors is more elastic.
IV) importance in international trade :-
it helps to determine trade between two countries. a country fixes more prices of the product whose demand is inelastic where as less price of the product whose demand is elastic.
v) useful to monopolist :-
for the monopolist the knowledge of elasticity of demand is essential. a monopolist will fix high price for those goods whose demand is inelastic less price for those goods whose demand is elastic.
Subscribe to:
Comments (Atom)

